

Ideological Identification in the United States
Understanding America's ideological shifts.


Political ideology is fiendishly difficult for individuals to wrap their heads around. Americans often lack deeply rooted policy preferences but can nonetheless navigate the political world by using ideological labels — Liberal and Conservative — as shortcuts to summarize their general beliefs about government’s proper role in society and the economy.
So goes the received wisdom at the “micro” level of politics. But for politics at the “macro” level, ideology is not a static identity but, rather, a dynamic reflection of how citizens process policy change and react to shifting political environment.
Ideological Identification
Public opinion research typically rely on self-reported placement on an ideological spectrum to capture Americans’ ideological identification. Some survey house, like GfK and Langer, offer respondents 5 choices (“very conservative,” “conservative,” “moderate,” “liberal” or “very liberal”), whereas Gallup only offers “conservative”, “moderate”, or “liberal.”
Such questions simplify a multi-dimensional “operational” ideology into discrete categories that allow us to map “symbolic” ideology over time. Because they correlate positively, though not perfectly, these measures approximate the broader dynamics of issue preferences — policy “mood” — of the electorate.
Figure 1 reports the trends from these four survey houses. Yet the distinct question wordings render distinct readings, making it hard to discern just how liberal or conservative the American public is in any given moment.
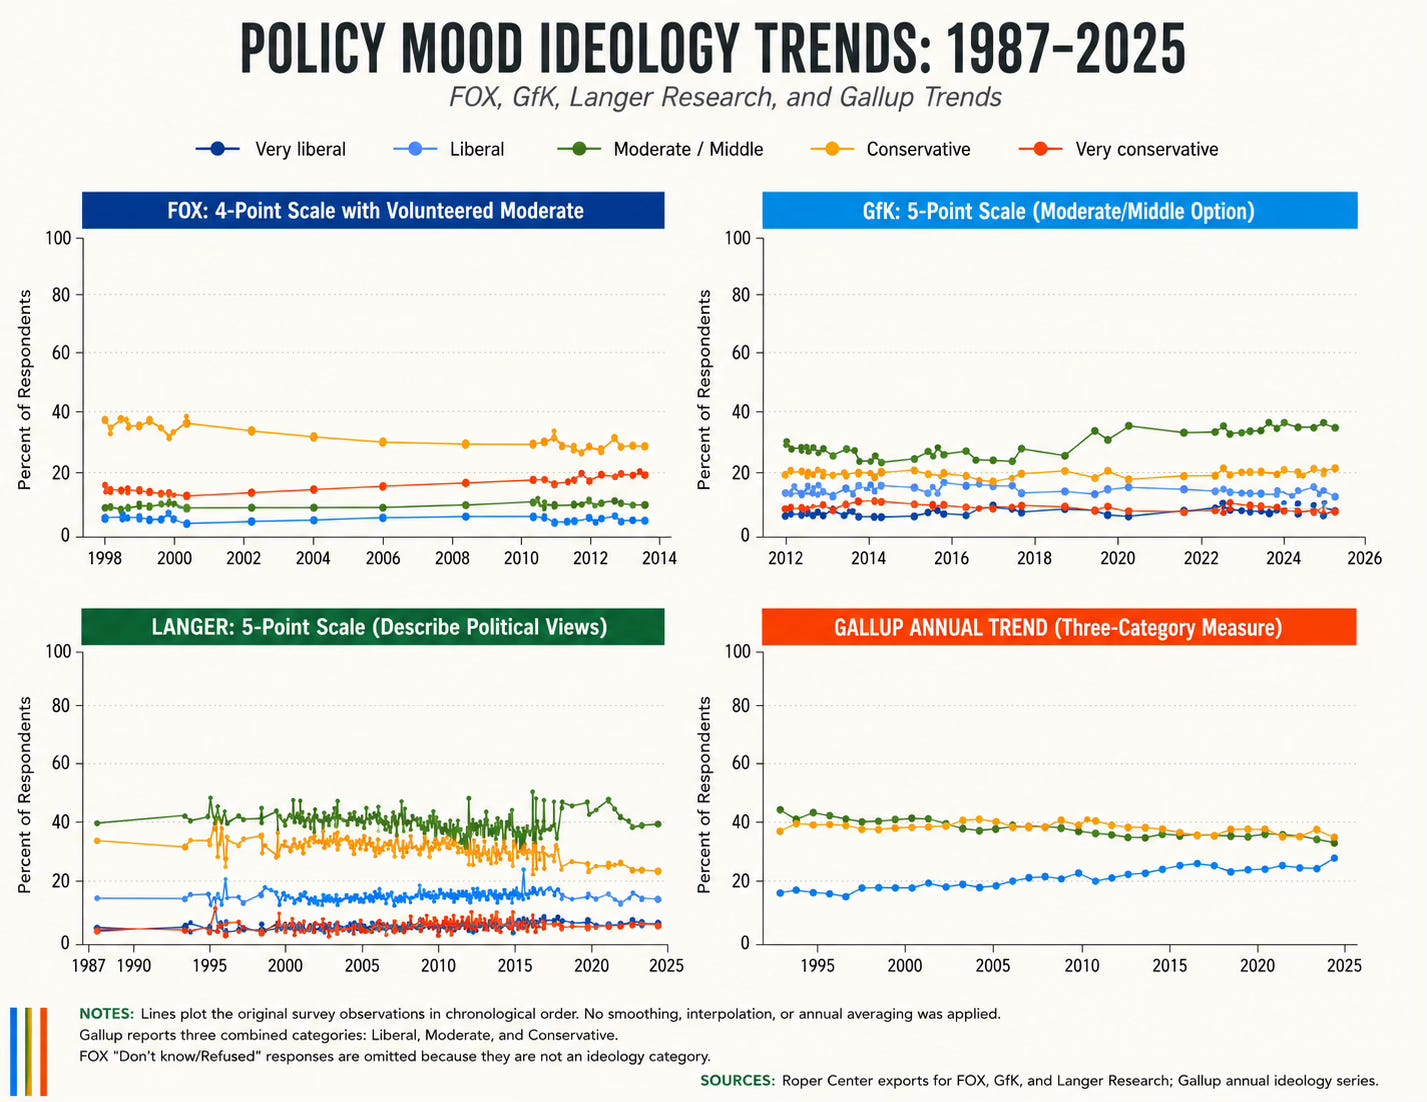
Figure 1 - Does contain images generated by ChatGPT. Image of data from listed sources, FOX, GfK, Langer, and GALLUP.
Macro-Ideology
A macro-political approach to ideology seeks to provide a summary number to track shifts in Americans’ symbolic ideology over time. Following in this tradition, we added the survey marginals above (housed at The Roper Center) to James A. Stimson’s historical dataset.
We estimated ideological liberalism from these surveys using Stimson’s “dyads-ratio” algorithm. The estimates capture the percentage of “liberal” responses divided by the sum of the percentages of “liberal” and “conservative” responses. So, higher values indicate greater symbolic liberalism.
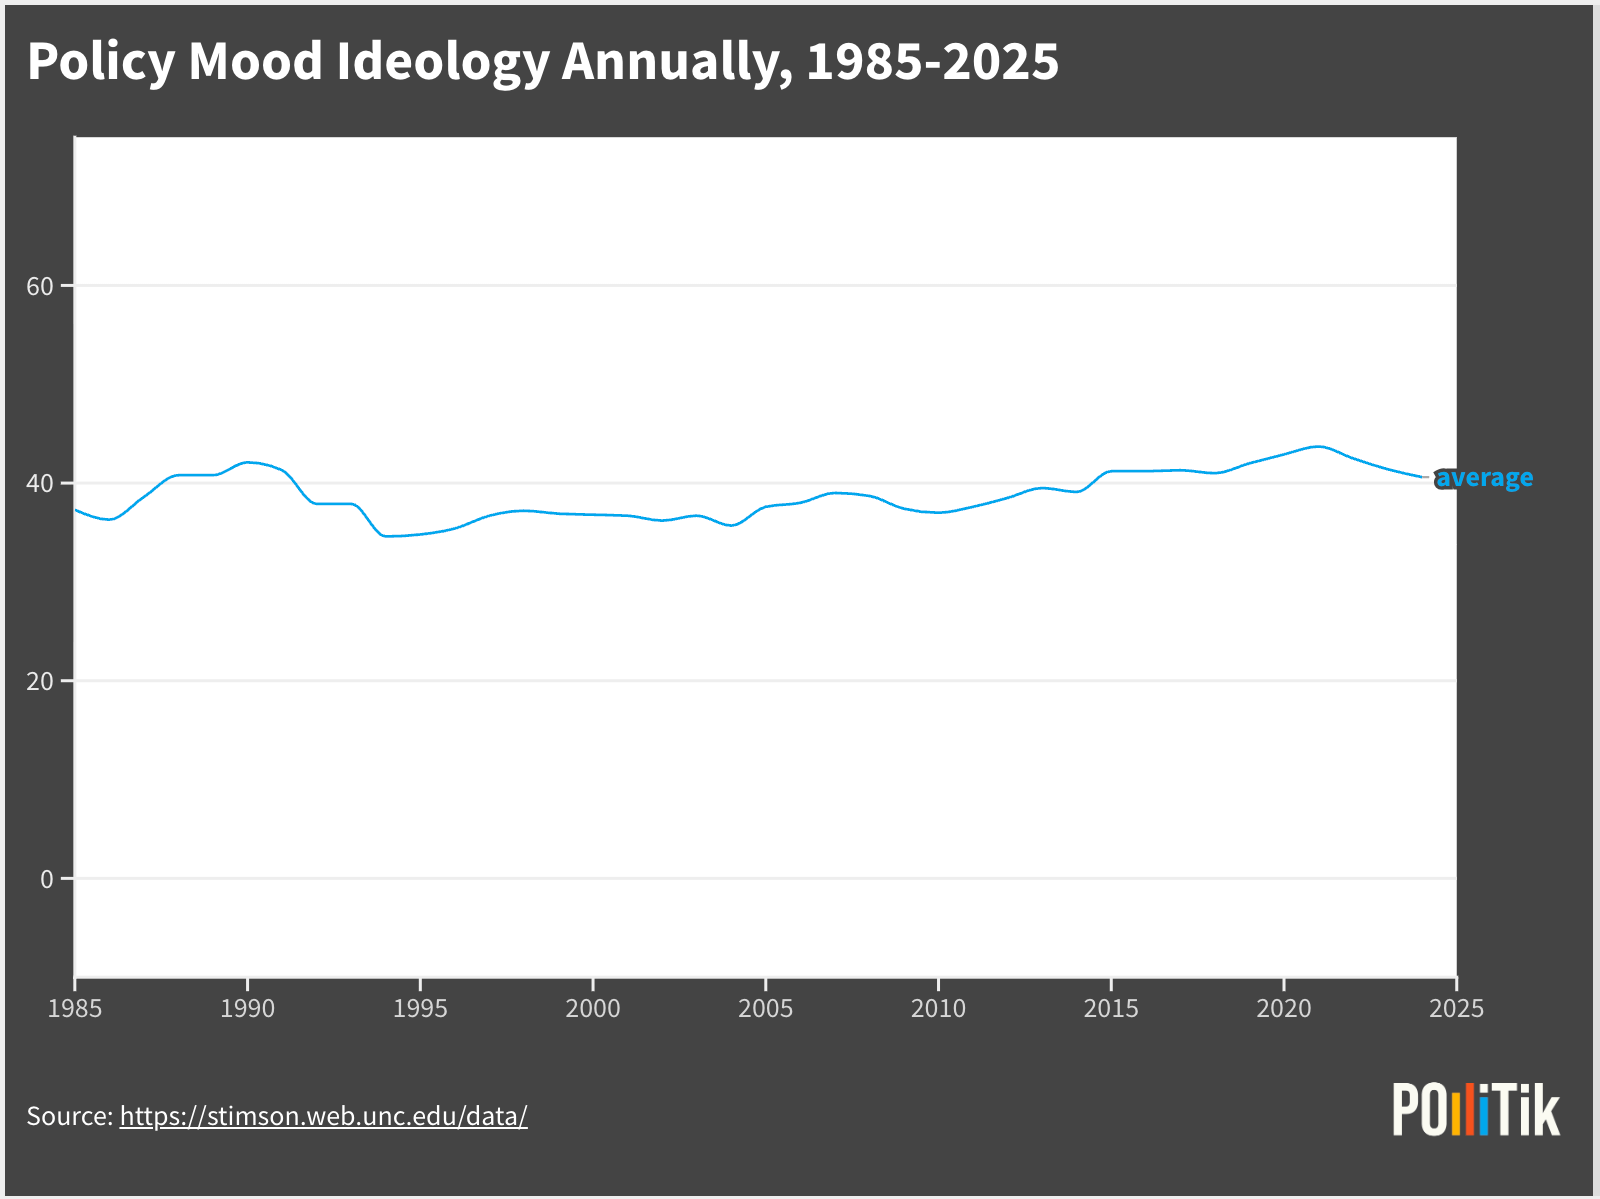
Figure 1.2 .Estimates represent the percent of liberal divided by the percent liberal + the percent conservatives. Data comes from James A. Stimson and our updates from The Roper Center. Estimates generated by the dyads-ratio algorithm.
Looking at Figure 1.2, we see that symbolic liberalism is also lower than symbolic conservatism (100 - liberalism), never passing the 50% threshold. Students of American politics have long documented Americans’ predilection for the “conservative” identity even as their policy stances often conflict with strictly conservative issue stances (e.g., Erikson et al. 2002, Stimson 2015).
Liberalism reaches crescendos around the the 1992 election of President Bill Clinton and the 2020 election of President Joe Biden. The 2021 reading of 43.7% is the peak of liberalism in our timeline. These observations beg the question: why does ideology move at all?
Thermostatic Dynamics
A key insight of the macro-political tradition is that public opinion is locked into a thermostatic relationship with policy. As first conceptualized by Christopher Wlezien (1995), the public’s reaction to government policies as akin to a thermostat adjusting a room’s temperature. Put in policy terms, if public policy leans too far in one direction, public preferences tend to swing back in the opposite direction.
Many societies experienced notable liberalization of social norms and values in the 1990s, driven in part by the rise of ideological liberalism—a philosophy emphasizing individual rights, free markets and secular progress.
The liberal category in the GFK, Langer and Gallup polls in Figure 1.1 experienced a minor spike between 2024 and 2025 coinciding with executive actions from the incoming Trump administration that pulled policies further to the right. This and similar cases suggest that public ideology is not fixed. Instead, the public reacts to the direction of government policy, in a thermostatic direction.
The dominant ideological position across the polls in Figure 1.1 above is moderate. This observation potentially reflects citizens having mixed policy stances or a reject of extreme positions. Likewise, our liberalism index in Figure 1.2 is moderate. The persistent concentration in the moderate category highlights how macro-level policy mood is shaped by micro-level cognitive complexity. Because most everyday citizens balance competing considerations, the electorate rarely shifts to ideological extremes. As Stimson’s thermostatic model suggests, the public acts as a stabilizing force. The stability of the moderate category in our research does not signify a lack of political engagement but reflects how the electorate continuously balances conflicting priorities.
2026 Midterms
The U.S. is quickly approaching midterm elections, with multiple states having concluded their primary run-off elections over the summer. Stimson might indicate that there will be a liberalism spike within these upcoming midterms, with increasing inflation and unemployment rates. Considering the current political climate is leaning further to the right, citizens may express their desire for a change at the voting polls. While people may symbolically identify as conservative, they may favor a transition in the liberal direction with their policy positions. American’s suffering the realities of increased inflation, in 2026, may recognize the significance of their majority conservatively run government. However, fear possibly remains with conservatives in associating the liberal identification directly with the Democratic Party. Will American’s be able to consciously separate ideology vs. political party?
Sources
Erikson, R. S., Mackuen, M. B., & Stimson, J. A. (2002). The Macro Polity. Cambridge: Cambridge University Press.https://doi.org/10.1017/CBO9781139086912
Fox News. (1998–2013). Political ideology survey data [Survey data]. Roper Center for Public Opinion Research, Cornell University. https://ropercenter.cornell.edu/ipoll/trend/4134d59b-b623-426d-92f9-8faf6b0ef332
Gallup. (1992–2025). Political ideology [Annual survey data]. https://news.gallup.com/poll/388988/political-ideology-steady-conservatives-moderates-tie.aspx
GfK. (2011–2024). Political ideology survey data [Survey data]. Roper Center for Public Opinion Research, Cornell University. https://ropercenter.cornell.edu/ipoll/trend/8ac2ad99-74d2-457c-a1d2-11b1ba741494
Alexander Kustov. Good to Know: The public is thermostat. Good Authority. goodauthority.org/news/good-to-knowthermostatic-politics-public-opinion/
Langer Research Associates. (1987–2023). Political ideology survey data [Survey data]. Roper Center for Public Opinion Research, Cornell University.https://ropercenter.cornell.edu/ipoll/trend/f3acca36-8be1-4032-a3eb-2569631e55b
Roper Center for Public Opinion Research. (n.d.). Roper iPoll database. Cornell University. https://ropercenter.cornell.edu/
Stimson, J. A. (2015). Tides of consent: How public opinion shapes American politics, Second Edition. Cambridge University Press.
Wlezien, Christopher. (1995). “The Public as Thermostat: Dynamics of Preferences for Spending.” American Journal of Political Science 39(4): 981–1000. https://doi.org/10.2307/2111666.
 | A guest post by
|
 | A guest post by
|