

Honeymoon Tracker

Pollitik’s Honeymoon Tracker for May compares the honeymoon periods of current leaders to those of their predecessors in four democracies that we have been tracking since March: the UK, Brazil, Ireland, and Italy. At that time, some but not all of the new leaders appeared to be exhibiting the typical u-shaped approval patterns associated with the electoral cycle.
Pollitik is now revisiting these democracies to determine if the deviation of these new leaders from the typical pattern is unique. Overall, even within this small sample, there is no clear evidence that these new leaders’ honeymoon periods are more deviant than those of their predecessors.
The graph below illustrates the honeymoon periods of current and previous leaders in these four countries using monthly data from the Executive Approval Database 3.0.
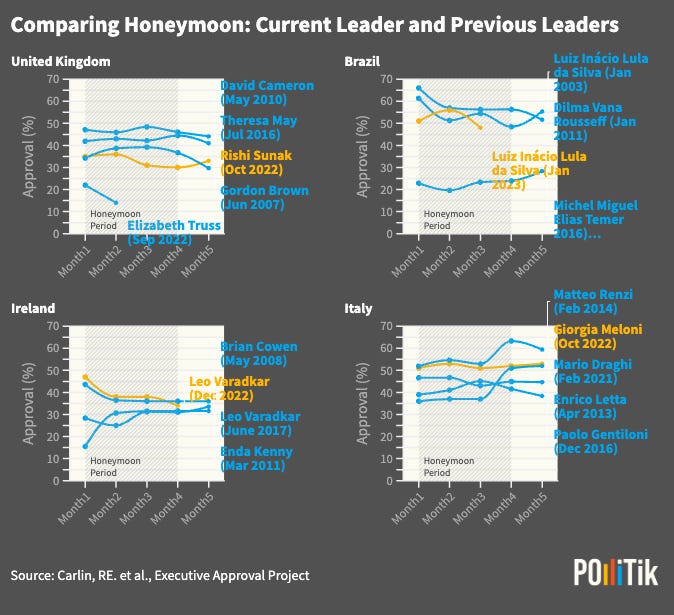
Rishi Sunak, the current prime minister of the United Kingdom, had the lowest approval rating in his third month of office, with only 30%. Of his most recent predecessors, David Cameron had the highest approval rating in his third month (49%).
In Brazil, Luiz Inácio Lula da Silva (first term) and Dilma Rousseff both began their terms with high approval ratings but underwent a nearly 10% drop in their second month. Michel Temer, in contrast, did not enjoy a honeymoon period when he took over for the impeached Rousseff; his approval ratings were always under 25% mark. Now back in power, Luiz Inácio Lula da Silva has experienced a volatile honeymoon period thus far–and it may well be over.
Incumbent Irish Taoiseach (prime minister) Leo Varadkar has seen his popularity drop steadily for four months. More than a decade ago, Enda Kenny surged about 15 percentage points in the second month, after starting at a very low 16% in the first month.
Finally, Italy’s Giogia Meloni has a stable approval rating of around 50%, a clear and robust honeymoon. Such stability is not found among Italy’s previous prime ministers. Specifically, Matteo Renzi and Mario Draghi saw their popularity increase more than 10 percentage points from their first to their fourth month in office.
To sum up, few of the most recent leaders in these four countries have strictly followed cyclical dynamics typically expected of them. Why?
Many commentators assume it has something to do with the rise of partisanship, affective polarization, and media echo chambers.
To explore this further, we explore the relationship between honeymoon period popularity and affective polarization. We use the United States as a case study, where polarization has increased most among OECD countries.
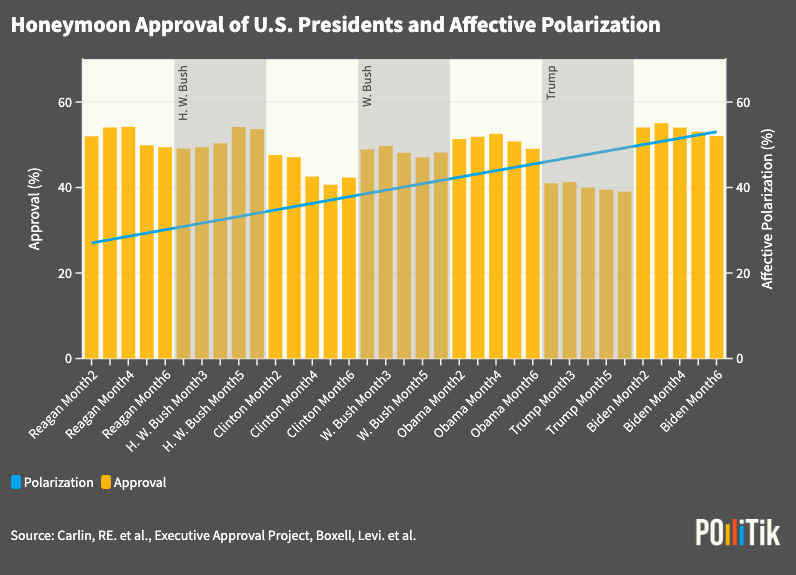
The graph above displays the approval rating of US presidents during the honeymoon periods, as well as the level of polarization from 1980s to 2020s.
It is difficult to identify a clear relationship between polarization and deviations from the expected approval rating during the honeymoon period. Therefore, we either need to control for confounding variables to reveal the relationship, or consider whether other factors may better explain why leaders’ honeymoon periods vary so much.
Honeymoon Tracker will explore this matter in its next iteration.